WBEZ brings you fact-based news and information.
Sign up for our newsletters
to stay up to date on the stories that matter.
Traffic. It’s something utterly mundane and expected, but when you’re inching through a major city on a car or bus, road congestion can be a kind of personal hell.
“I feel like a terrible commute is only terrible to the person who’s living it,” observes our question-asker, Esther Bowen. She’s a resident of Chicago’s Bucktown neighborhood who commutes about 45 minutes each way to her job in suburban Lemont. That’s provided plenty of time for her to formulate this question for Curious City:
What factors influence daily, weekly, and seasonal traffic patterns in the Chicagoland region?
If you can’t sympathize with Esther, you should know that traffic affects you, even if you don’t drive or ride the bus. All the congestion on Chicago-area roads sucked up more than $6 billion in wasted time and fuel in 2011, according to the Texas A&M Transportation Institute. That’s third among the 101 metro areas they assessed.
Of course, a lot of that wasted time is in what commuters like Esther might consider “typical” traffic jams. And that’s how we’re going to help her: by laying out what the “expected” traffic patterns actually are. We’ll then have officials and researchers account for these variations, as well as what contributes to road congestion in the first place.
We can’t guarantee that this information will necessarily make Esther or any other commuter happy to be on the road, but maybe it can steer folks clear of any traffic-induced personal hell.
Traffic pattern: A typical day, measured hour by hour
It’s no secret that the length of your commute can depend on what time you start it. Citing data from the Federal Highway Administration and elsewhere, the Texas Transportation Institute’s Bill Eisele says bottlenecks — simply more drivers on the roads than the roads can accommodate — are responsible for about 40 percent of all traffic congestion nationwide.
But when it comes to a typical day in the Chicago area, when do drivers hit the heaviest traffic?
Figures from the Illinois Department of Transportation show that on average, the hours ending at 4 p.m. and 5 p.m have the highest share of the day’s traffic on Northeastern Illinois’ interstate highways. The worst morning hour, which is not as heavy as the afternoon peak, is from 7 to 8 a.m.
Why is the morning rush hour generally lighter than the afternoon-evening rush hours? Citing data from the Federal Highway Administration, Nebiyou Tilahun, an assistant professor of urban planning at the University of Illinois Chicago, says it’s because people are doing more than just commuting in the afternoon.
“In percentage terms, commuting dominates over other types of trips in the morning. In the afternoon, it is one of several trip types that congest the roadway. Family and personal trips as well as social/recreation trips are made with more or almost equal frequency,” he says.
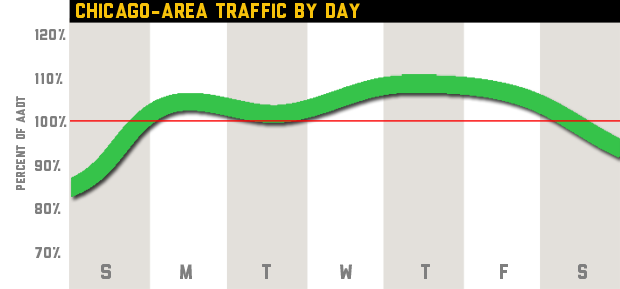
Traffic pattern: A typical week, measured day by day
The discrepancy between morning and evening rush hours is even most pronounced on Friday, which IDOT says is generally the heaviest traffic day of the week in the Chicago area.
“Thursday and Friday tend to be our worst p.m. rush hours,” says IDOT’s Matt Daeda. “Oddly enough, we’ve noticed in the past few years during the summer months our a.m. [Friday] rush hour tends to be a lot lighter than the other days of the week.”
They think that’s due to people taking long weekends, working from home, or otherwise shifting toward a four-day work week in the summer months. IDOT Spokeswoman Carson Quinn says they’re seeing this pattern start to emerge on summer Thursdays, too.
Seattle-based traffic data firm INRIX agrees that Friday evening’s commute is the single worst of Chicago’s week. But the Chicago area’s worst commute day overall “is a toss-up between Wednesday and Thursday,” according to spokesman Jim Bak.
Traffic pattern: A typical year, measured month by month
Summer is the worst season for Chicago-area traffic, in part because of the increase in construction work. According to Bill Eisele of the Texas Transportation Institute, construction is the fourth-leading cause of road congestion and is responsible for 10 percent of traffic jams nationwide.
IDOT says average weekday traffic increases on all of the Chicago area’s major highways during the summer, but by different amounts. The Stevenson (I-55) sees the biggest jump, with as much as 12 percent more traffic, while traffic on the Eisenhower (I-290) only increases by 3 percent. The Kennedy and Edens (I-90 and I-94) get 8 and 11 percent more clogged, respectively.
But fall also sees a significant uptick in travel times. Jim Bak, a spokesman for INRIX, relays this office adage about seasonal traffic patterns: “Back to school, back to work, back to traffic.”
“On a seasonal basis, the biggest impact is school schedules,” says Bak. “Nationally, it can increase traffic congestion levels by up to 15 percent. In Chicago we see an annual lift of up to 10 percent.”
What about reverse commutes?
As a city dweller who treks out to the suburbs during business hours, our question-asker, Esther, is a so-called reverse commuter. Suburban development and job growth has taken off in recent decades. That has created a surge in urbanites with suburban occupations, like Esther. So, naturally, she wants to know if her increasingly common arrangement results in less traffic compared to the traditional commute from the suburbs to the city.
“In general the traditional commute still is heaviest, more often than not,” says IDOT’s Carson Quinn. But that’s not the case for all local expressways. On the Edens Expressway (I-94), for example, northbound traffic is heaviest in the morning while southbound is worst in the evening, suggesting a flow of traffic away from downtown for the workday. The Kennedy (I-90) is the same.
What contributes to traffic?
So that’s the basic answer to Esther Bowen’s questions about Chicago’s worst hours, days and seasons for traffic. But what are the general factors that influence traffic patterns?
According to the Federal Highway Administration, the major contributors are what you might expect: Bottlenecks, or just the sheer number of cars on the road, make up 40 percent of congestion nationwide. Traffic accidents and related slow-downs cause about 25 percent, while bad weather is responsible for 15 percent of lurching road travel. Construction is the last major cause, at 10 percent. The remaining 10 percent is due to things like poor signal timing, special events (like sports games and festivals) and other lesser factors.
Chicago doesn’t deviate much from that national average, according to Steve Travia — he’s IDOT’s District 1 bureau chief for traffic, responsible for overseeing traffic management and reporting in the six-county greater Chicago area. Traffic engineers at IDOT’s District 1 headquarters monitor regional traffic on a bevy of video and computer monitors, switching the direction of express lanes and dispatching crews to clear accidents.
Bottlenecks and the like are perennial leaders in causing congestion, a fact he says is due to some basic physics.
“There’s a break point. There’s a capacity limit of how many cars will truly fit on a lane of pavement,” says Travia. Depending on the types of vehicles, traffic signals, topography and other factors (beyond just the size of the road), that capacity can vary. But as you approach what IDOT calls “saturation,” traffic will begin to slow down. People can change their driving habits to a certain point but, Travia says, “then you hit that magic number. … And that’s when it breaks down. That’s when you start to get that accordion effect.”
Traffic engineers call that “disrupted flow”, and it ripples out quickly. In fact, Travia says, every minute an accident blocks a lane of traffic adds roughly three minutes of congestion on that highway.
What about weather? It seems, given our polar vortices and generally volatile weather, Chicagoans would see weather higher up in the relative breakdown of Chicago’s traffic factors. But Kermit Wies, deputy executive director for research and analysis at the Chicago Metropolitan Agency for Planning, says it appears only about 13 percent of Chicago’s traffic congestion occurs when the weather is wet, snowy or icy. So while those long winters can be brutal, and they do help to clog the roadways, they’re not game-changers when it comes to the broadest traffic patterns.
There are also surprising forces behind traffic patterns.
“If people have jobs, they have money to spend, resulting in not only more commuter traffic but also more traffic in general as people go out to have dinner, to shop, go to a movie or cultural event, etc.,” says INRIX’s Jim Bak. “Even now when more people tend to shop online, the product eventually has to get to your house from a distribution center — that happens on a truck.” That means more raw materials are being delivered to manufacturing plants, and more freight to stores as they replenish inventory to keep up with increased consumer demand.
Freight traffic also impacts Chicago’s commuters directly. The Texas Transportation Institute’s Bill Eisele put it optimistically: “Chicago is an exciting, dynamic, multi-modal town.” But that also means motorists in the Chicago area, which sees up to a quarter of the entire nation’s freight traffic, have to deal with the added congestion of trucks and train crossings. TTI’s Urban Mobility Report estimates truck congestion alone cost Chicago more than $1.7 billion in lost time and fuel in 2011, the most recent year for which they’ve crunched the numbers.
Infrastructure improvements could help ease that pain, Eisele says, as could an increase in public transit ridership.
“For critical high-volume routes (like expressways),” says Kermit Wies, of the Chicago Metropolitan Agency for Planning, “traffic managers will use Intelligent Transportation Systems (ITS) such as in-road sensors and cameras to make real-time decisions to close ramps and upstream lanes, issue signboard messages or media blasts in an effort to keep delays to a minimum.”
That response is improving constantly, building on a general slump in miles driven per capita.
Probably better to focus on that than the time and money you’re wasting the next time you’re caught in a bad bout of congestion on Chicago-area highways.
Who asked our question?
Esther Bowen’s curiosity is both personal and occupational. She commutes from Chicago’s Bucktown neighborhood to Argonne National Laboratory, where she has worked as a scientist in the soil and groundwater sampling division for nearly three years. The trip usually takes about 45 minutes in the morning and an hour on the way back after work. That’s plenty of time for her scientific mind to wade through the reasons that I-55 might flow freely one day and clog up the next.
“I do kind of hate that I waste that much time in traffic,” she says. “I feel like — psychologically — if I can understand why it is, it would help to deal with it.”
Esther and her husband, Aaron, moved to Bucktown from Chicago’s Lakeview neighborhood in part to shave time off her commute. She remembers one trip back from work when they lived in Lakeview took two hours, thanks to rain showers and a Cubs game.
Esther’s parents still live in her hometown of Crystal Lake, Illinois — about 45 miles northwest of downtown Chicago — so substantial commutes factor into her personal life as well as her career.
Most of her friends live and work in the city, and she’s not expecting sympathy from them. Instead, she says she just hopes to satisfy a personal curiosity.
“I feel like a terrible commute is only terrible to the person who’s living it,” she says.
The data driving our presentation
Charts in our presentation use the term Annual Average Daily Traffic, or AADT, which means traffic engineers measured the total number of cars in a year on a given road and divided by 365 days. We followed the Illinois Department of Transportation’s format, so when AADT is above 100 percent, it means that time period experiences greater than average traffic.
Now, a few words on how traffic is measured, generally speaking. Even if you’ve never nerded out over traffic engineering, this will be relevant if you’ve ever used your phone to navigate on the road.
A lot of the information gathered by the federal and local transportation agencies comes from inductive-loop traffic detectors — magnetic loops embedded in the pavement of highways and some smaller streets. The devices measure the number and size of vehicles passing over them. From this information, traffic engineers glean travel times using mathematical formulas.
Luckily for traffic geeks, there is a lot more data out there these days. Many of us travel with mobile devices and, while we do, Wi-Fi, Bluetooth and GPS components log data about our location at any given time. Google and other companies use that information to estimate the flow of traffic, and then deliver that data back through map programs and services.
Chris Bentley is a freelance writer and reporter for WBEZ’s Curious City. Follow him at @cementley and at cabentley.com.
The above guide was compiled by previous WBEZ traffic reporter Sarah Jindra. It details major highway routes around the city and could also help make sense of the traffic reports you hear on the radio.